
Figure 2.
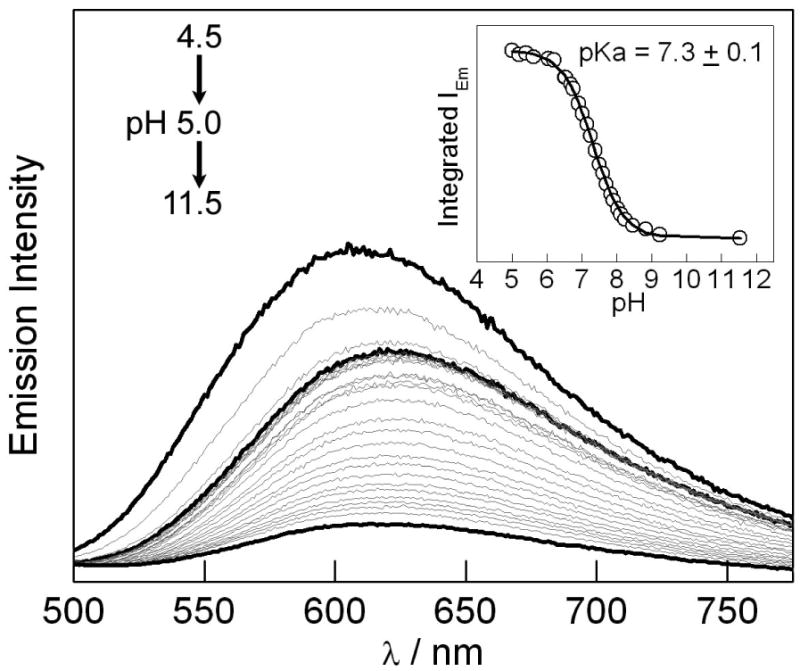
Emission spectra of [Re]-3,5-F2Y-βC19 as a function of pH, which was titrated from 4.5 to 11.5. Black curves correspond to emission at pH 4.5, 5.0 and 11.5. Inset: pH Titration curve of integrated emission intensity from pH 5.0 to 11.5.
Official websites use .gov
A
.gov website belongs to an official
government organization in the United States.
Secure .gov websites use HTTPS
A lock (
) or https:// means you've safely
connected to the .gov website. Share sensitive
information only on official, secure websites.
Emission spectra of [Re]-3,5-F2Y-βC19 as a function of pH, which was titrated from 4.5 to 11.5. Black curves correspond to emission at pH 4.5, 5.0 and 11.5. Inset: pH Titration curve of integrated emission intensity from pH 5.0 to 11.5.