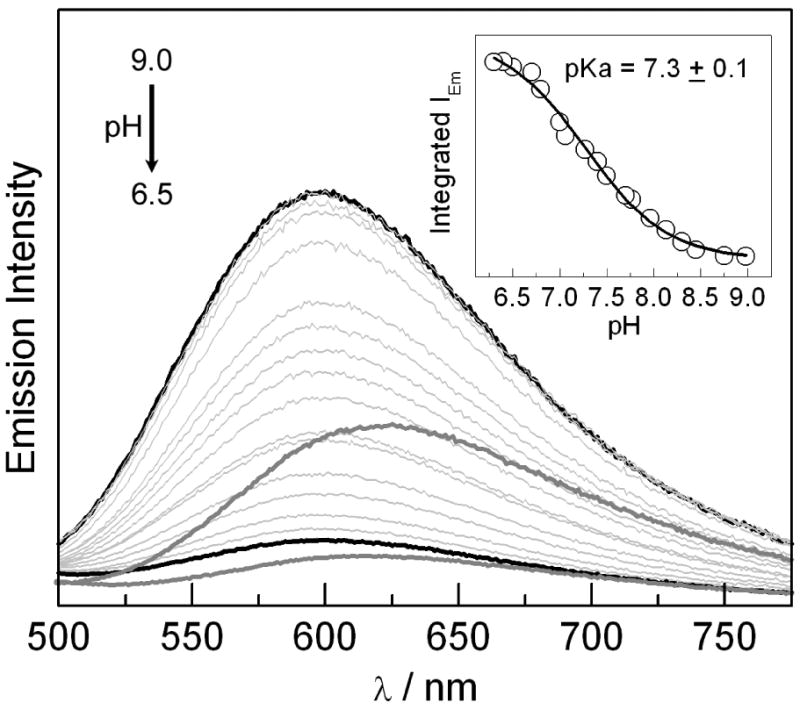
Figure 4.

Emission spectra of [Re]-3,5-F2Y-βC19 (5 μM) and α2 (20 μM) as the pH is titrated from 9.0 to 6.3. The solid black curves correspond to the endpoints of the titration at pH 9.0 and pH 6.3. The dark grey traces are spectra recorded at pH 6.3 (lower spectrum) and pH 9.0 (upper spectrum) in the absence of α2. Inset: Integrated emission intensity as a function of pH (○) with fit (—) to monoprotic titration curve.
