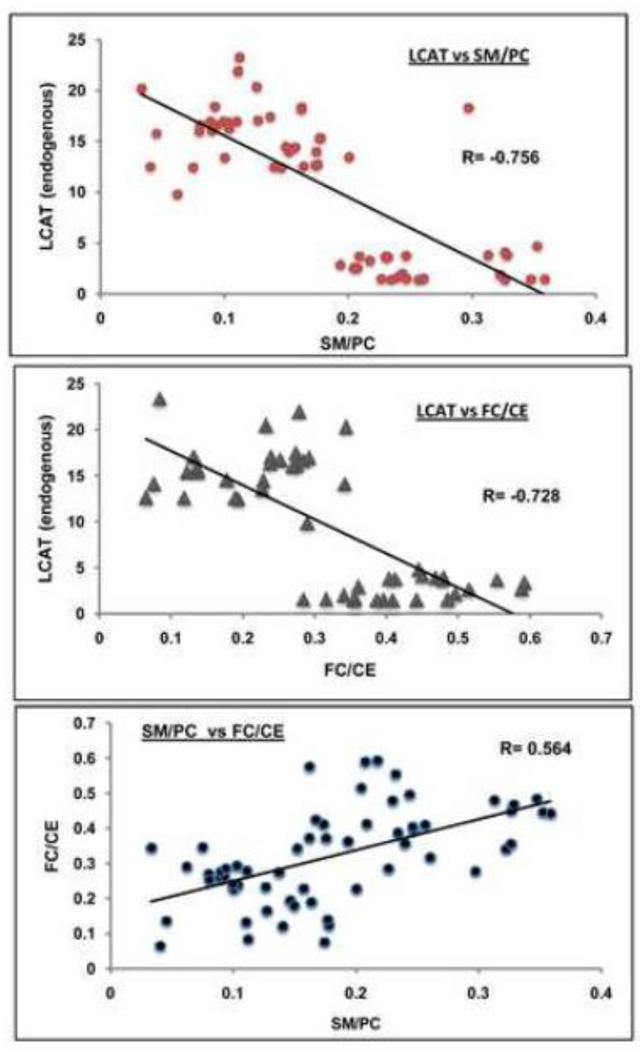
Figure 5.
Correlation of the LCAT fractional esterification rates (endogenous substrate) with SM/PC (top) or FC/CE (middle), and correlation of SM/PC ratio with FC/CE ratio. Pearson correlation coefficients were calculated in Microsoft Excel for the combined samples from all groups, where both the enzyme activity and the lipid values are available for each sample (n=60 for the SM/PC vs. LCAT; n= 49 for FC/CE vs. LCAT; n=60 for SM/PC vs. FC/CE).

