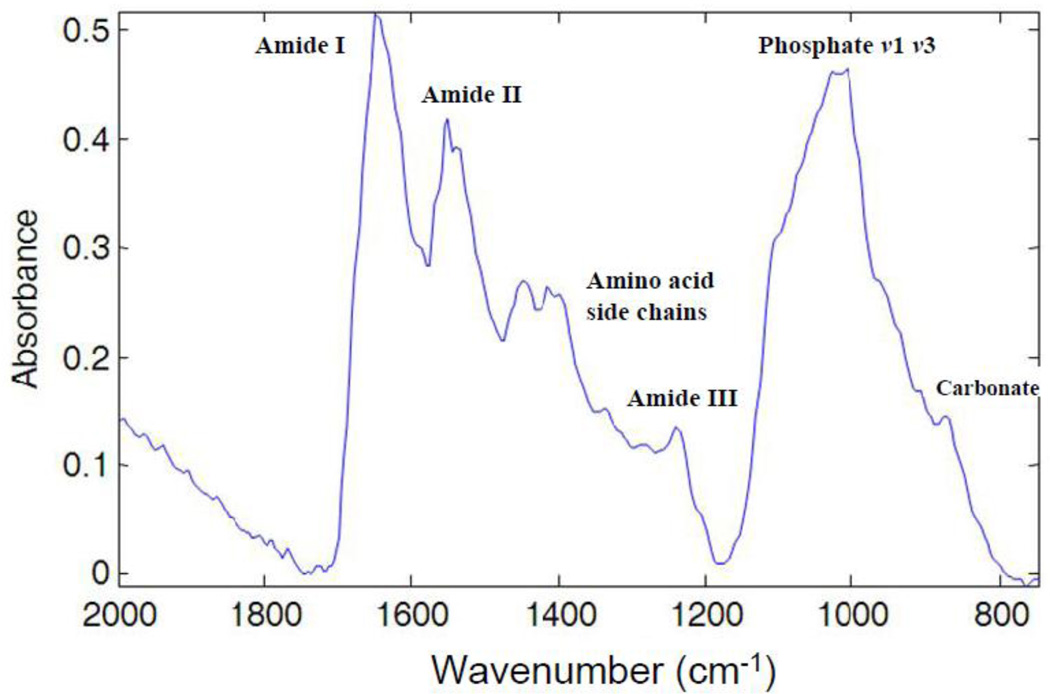
Figure 3.
Illustration of a typical FT-IRIS spectrum of mineralized vibrissae. The bands associated with the vibrations of organic bonds from proteins are shown as amide I (C=O stretch) centered at 1650 cm−1, amide II (C-N stretch and N-H in-plane bending mode) centered at 1550cm−1, amino acid side chain vibrations due to C-H bending motions (overlapping bands 1500–1360 cm−1) and amide III combination band centered around 1250 cm−1, and absorbances from carbonated calcium phosphates as phosphate ν1, ν3 (1200–900 cm−1), and carbonate ν2 (890–840 cm−1).

