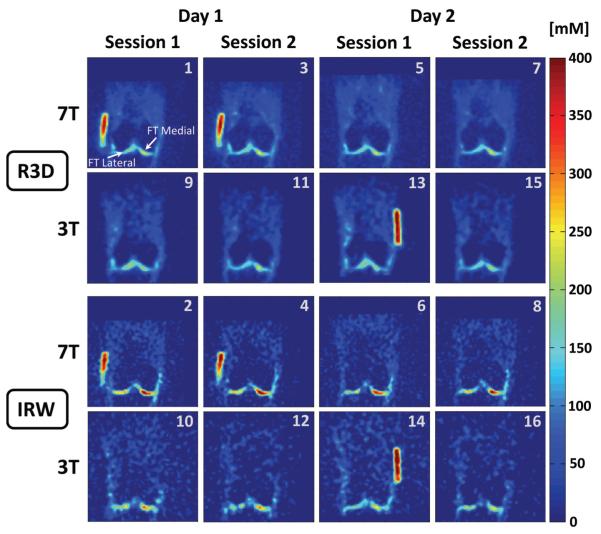
Figure 3.
Representative example of all the sodium concentration maps in the coronal plane acquired on the same volunteer as Fig 2. All the images were co-registered. The number in the top-right corner of each image corresponds to the acquisition number in the protocol as described in Fig.1B. Note that in some cases (3T-day 1 and 3T-day 2), the volunteer had to take a break between 2 sessions, therefore the calibrations phantoms (gels) could not be placed exactly at the same place between session 1 and 2 and do not appear at the same position in some slices presented here.

