
Fig. 4.
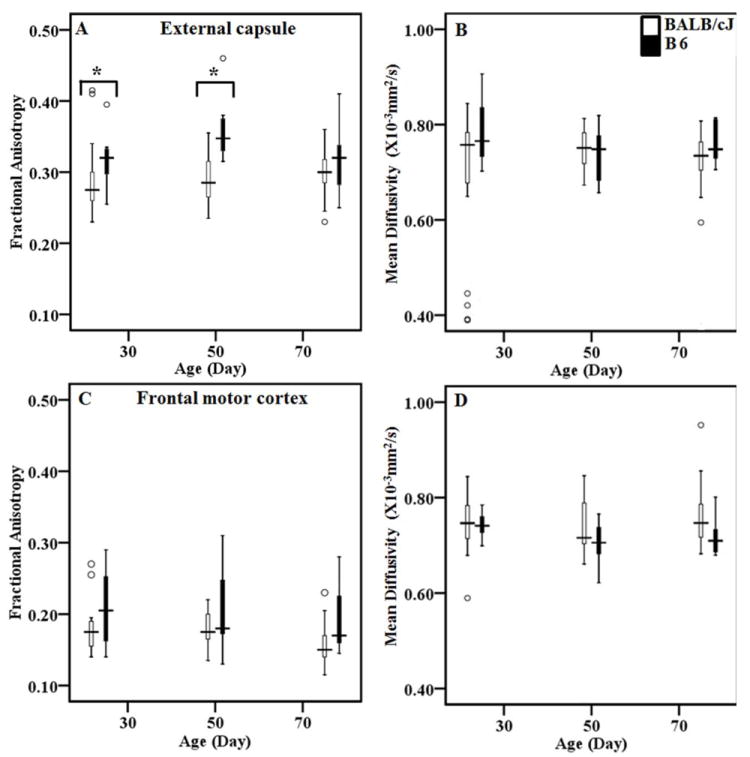
Box plots demonstrating the FA and MD (×10-3mm2/s) values from the external capsule (A and B) and frontal motor cortex (C and D) in BALB/cJ and B6 at 3 time points. Figure (A, C) show FA and (B, D) show MD values at 3 time points from BALB/cJ and B6. White boxes represent data from BALB/cJ while black boxes represent values from B6 mice. The upper edge of the box indicates the 75th percentile of the data set, and the lower edge indicates the 25th percentile. The line in the box indicates median value of the data. The data ranges are represented with lines extending the boxes, while the circles indicate outliers. Asterisk (*) represents statistically significant differences.