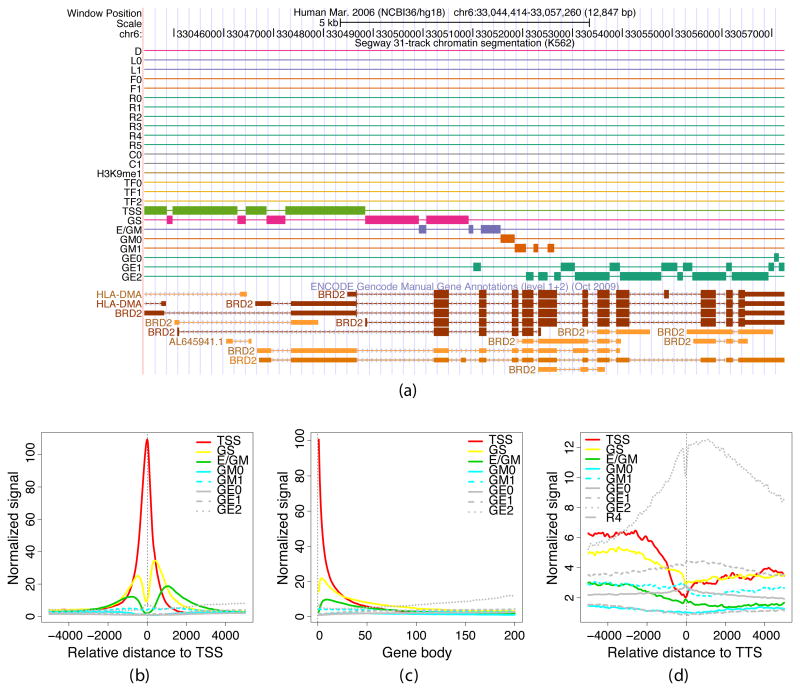
Fig. 2.
Gene structure in Segway labels. (a) Segmentation of the BRD2 locus, as shown in the University of California, Santa Cruz (UCSC) Genome Browser. The first three rows show the position along chromosome 6 and a scale bar. The next 25 rows correspond to the labels of the segmentation, with a thick bar present at any position where the segmentation has the corresponding label5. Labels are colored by functional category. The bottom rows show GENCODE manual gene annotations. (b)–(d) Aggregation of gene-related Segway labels with respect to the starts, middles and ends of protein-coding genes from GENCODE v7. Each panel plots the mean density of a set of gene-related Segway labels as a function of genomic location relative to (a) the TSS, (b) the gene body, extending from the TSS to the TTS, and (c) the TTS. The frequency of each label (vertical axis) is normalized by the relative proportion of the genome that is covered by that label. Genomic distances in the center panel have been scaled to a proportion of gene length.

