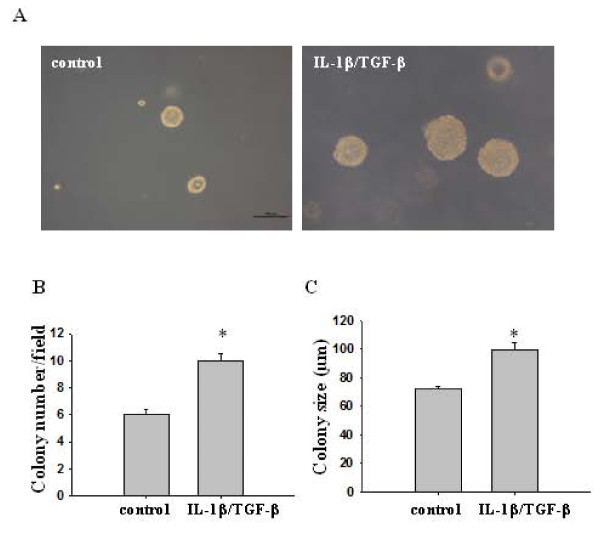
Figure 4.
IL-1β/TGF-β-treated cells form more and larger colonies than control cells in soft agar. Single control or IL-1β/TGF-β-treated cells were plated in soft agar containing DMEM and 10% FBS in six-well plates at a density of 10,000 cells/well and cultured for 14 days. (A) Representative images of the colonies derived from the control and IL-1β/TGF-β-induced neurosphere cells. Scale bar = 100 μm. Colony number was counted under a microscope as shown in (B) and size was measured using ImageJ as shown in (C). Twenty random fields were selected for measurement and the data represent the average colony number and size per microscope field. *P < 0.001.

