Figure 5.
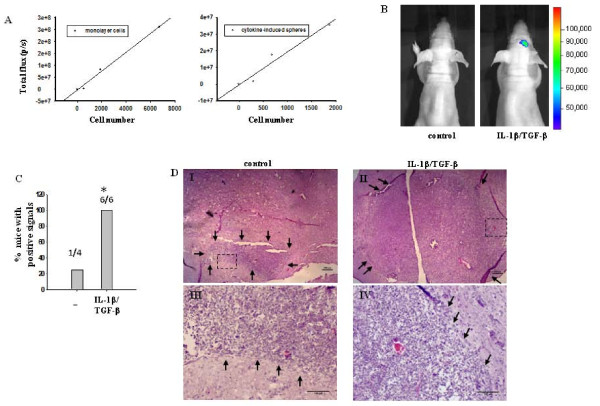
IL-1β/TGF-β-induced neurosphere cells have increased tumorigenic potential. (A) Bioluminescence characteristics of LN-229 cells. Various numbers of LN-229 cells expressing Gaussia luciferase were cultured in 96-well plates in SFM in the absence or presence of IL-1β/TGF-β for seven days, then incubated with 60 μg/ml coelenterazine and imaged with a scan time of one minute. After imaging, cells were counted under a microscope. The relationship between bioluminescent signal strength and cell number for control monolayer LN-229 cells (left panel) and for IL-1β/TGF-β-induced neurosphere cells (right panel) was reported here. (B) Representative images of mice injected intracranially with control or IL-1β/TGF-β-induced neurosphere cells. 3 × 10⁵ cells of the control monolayer or IL-1β/TGF-β-induced neurosphere cells expressing Gaussia luciferase were injected into each nu/nu mouse brain at 1 mm anterior, 2 mm from bregma to right lateral and 3.5 mm intraparenchymal. Images were taken five weeks after cell injection, two minutes after administering coelenterazine i.v. with a scan time of one minute. (C) The percentage of mice which had at least three times higher bioluminescent signal at the injection site than the background signal. *P < 0.05. (D) H&E staining of cryosectioned mouse brain five weeks after injection with control monolayer cells or IL-1β/TGF-β-induced neurosphere cells. Small black arrows demarcate tumor margin. (III) and (IV) Amplified images of the areas indicated by rectangles in (I) and (II), respectively. Scale bars in (I) and (II) = 200 μm. Scale bars in (III) and (IV) = 100 μm.

