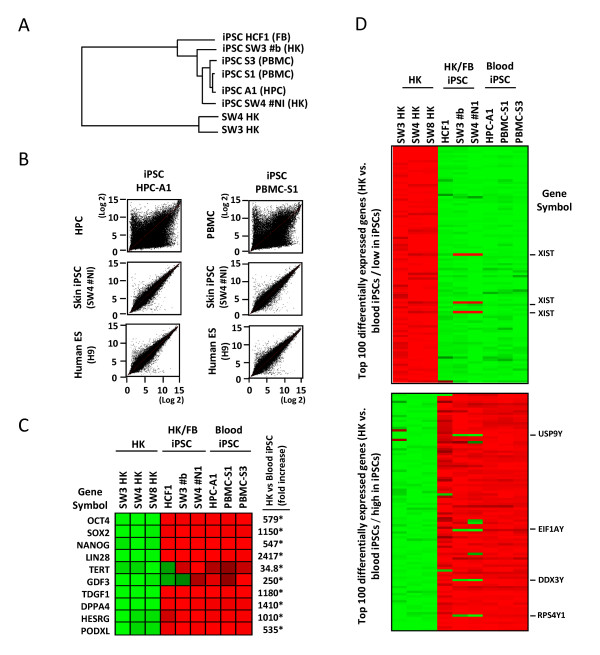
Figure 4.
Global gene-expression profiles of blood-derived iPSCs. (a) Dendrogram describing the unsupervised hierarchal clustering of primary keratinocytes (SW3 HK and SW3 HK), and keratinocyte (HK)-, fibroblast (FB)-, and HPC- and PBMC-derived iPSCs. (b) Genome-wide gene-expression patterns of HPC- and PBMC-derived iPSC clones were compared with those of HPCs (GSM178554), PBMCs (GSM452255), verified epidermal keratinocyte-derived iPSCs (SW4#N1, upper panels), or embryonic stem cells (H9 cells, GSM190779). (c) Heatmap demonstrating the relative expression levels (high, red; low, green) of pluripotency-associated genes in primary keratinocytes (HK) and iPS cells from HK, FB, or blood cell sources. The changes in gene-expression levels in blood-derived iPSCs, relative to those in HK cells, were calculated by using the microarray data from three primary HK cells and three blood-derived iPSCs, and shown as fold-increase in iPSCs. Statistically significant changes are indicated by asterisks (P < 0.05). (d) Heatmap showing the top 100 differentially expressed genes between non-reprogrammed HK and blood-derived iPSC clones. Highly expressed in non-reprogrammed cells and blood-derived iPSCs are shown in upper and lower panels, respectively. Genes with notable differences in gene-expression patterns between HK/FB-derived and blood-derived iPSCs are indicated by the gene symbols on the right.

