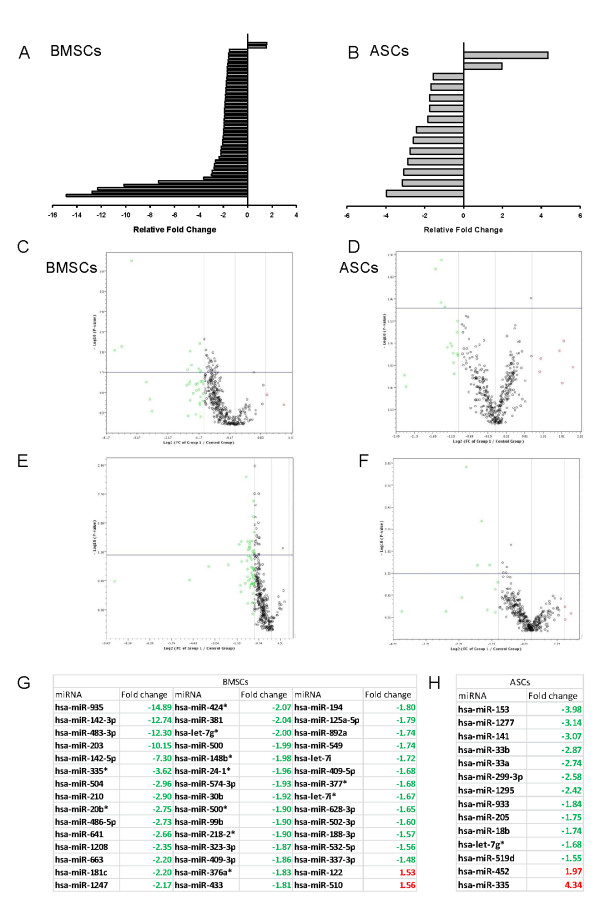
Figure 3.
Age-dependent changes in miRNA profiles of adipose stem cells (ASCs) and bone marrow stem cells (BMSCs). (a) Statistically significant up- and downregulated miRNA in BMSCs. (b) Statistically significant up- and downregulated miRNA in ASCs. (c, d) Volcano plot of miRNA exhibiting P < 0.05 in expression as a result of BMSCs donor age. (e, f) Volcano plot of miRNA exhibiting P < 0.05 in expression as a result of ASCs donor age. (g) Fold regulation of significant miRNA in old versus young BMSCs donors. (h) Fold regulation of significant miRNA in old versus young ASCs donors. Upregulated miRNA are denoted in red, downregulated miRNAs are green, and miRNAs not statistically significant are black. Horizontal blue line represents P-value cutoff (P < 0.05), and vertical grey lines represent fold-change cutoff (more than twofold).

