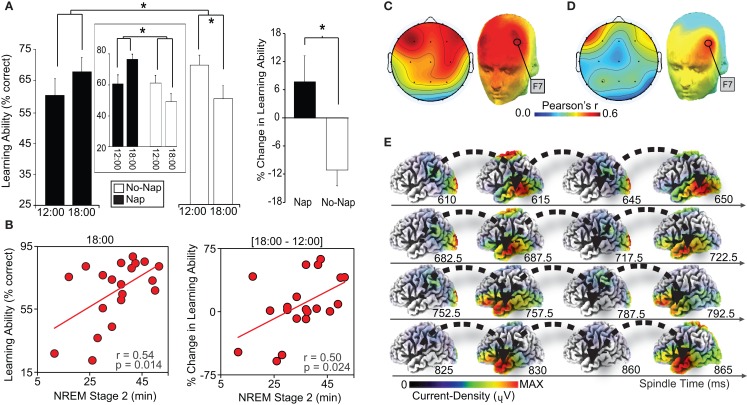
Figure 3.
(A) Episodic learning ability (% face-name pairs encoded) in the nap and non-nap group at 12:00 and 18:00 (left), and the change in episodic learning ability between sessions (18:00–12:00; right). Episodic learning ability in a subset of nap and no-nap subjects (n = 10 per group), matched on initial 12:00 performance, is presented in the center box. Comparisons (line across bars) in both plots reflect significance* at: p < 0.05. Error bars represent S.E.M. (B) Within the nap group, correlations with stage-2 NREM sleep and episodic learning ability at 12:00 (left-panel), 18:00 (middle-panel), and the change in learning ability between session (18:00–12:00; right-panel). (C) Topographic correlations (color-bar indicates Pearson’s correlation strength) in the nap group between fast sleep spindles and episodic learning ability at 18:00 (post-nap), significant in derivations F3, F4, Fz, F7, F8, Fp1, and Fp2 over PFC, maximal at F7 (r = 0.536, p = 0.018). (D) Of these derivations, the change in episodic learning ability (18:00–12:00), significantly and conjointly correlated with fast spindles at derivation F7 over left PFC (r = 0.535, p = 0.018). (E) sLORETA source time-series of fast sleep spindles identified by onset at F7, demonstrating a current-density loop recurring in left temporal lobe, proceeding the peak of the spindle. Modified from Mander et al. (2011).

