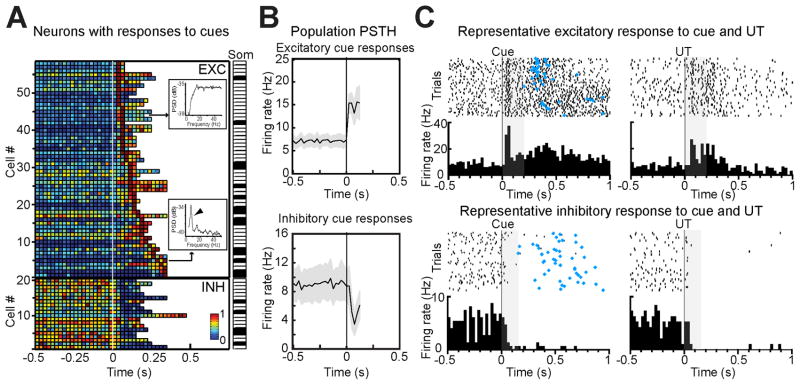
Figure 3.
Cue-evoked anticipatory responses in GC. A. Population plot of all the neurons producing significant responses to tones. Each row on the y-axis represents a neuron, the x-axis is time around cue onset (white line, t = 0), the color of each square describes the normalized firing rate within a 25 ms bin (see color bar). Top: neurons with excitatory responses (n = 58), bottom: inhibitory responses (n = 20). The insets show the power spectra for representative non-somatosensory (top) and somatosensory (bottom) neurons. The arrowhead in the power spectrum plot points to the peak in the licking frequency. The strip plot to the right (“Som”) indicates the cells with (black) and without (white) a somatosensory peak. B. Population PSTH in response to anticipatory cues (0.5 s before to 125 ms after the cue; bin width = 25 ms). Top: average of neurons with no somatosensory peak showing excitatory responses (n = 43); bottom: average of inhibitory responses (n = 15). Gray shading around each trace: SEM; t = 0 is the onset of the cue. C. Raster plots and PSTH (25 ms bin width) for two representative neurons responding to the tone cue (left) and UT (right). Top: excitatory response; bottom: inhibitory response. The gray box marks the interval between the onset of the cue and the first lever press. Blue diamonds: time of lever press.

