Figure 6.
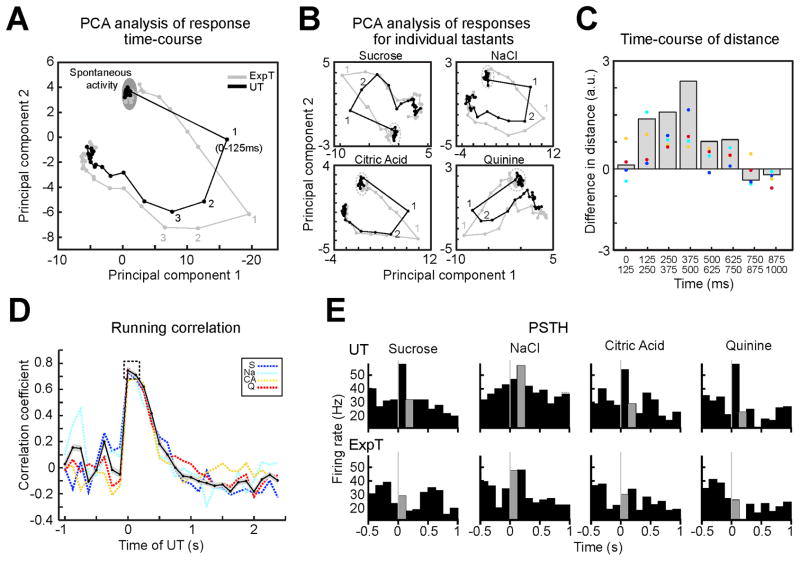
Expectation changes the time-course of sensory responses in the subpopulation of pyramidal neurons. A. PCA based visualization of population activity evoked by ExpT (gray) and UT (black). Note that the first bin of the response to ExpT (1st gray) gets closer to the second bin evoked by UT (2nd black). B. PCA analysis for individual tastants confirms the same patterns as in panel A. C. Difference between the distance in a PCA space of homologous bins (i.e. 1st–1st) and successive bins (i.e. 1st–2nd) in the two conditions. Gray histogram: difference for trajectories averaged across tastants; color coded dots: difference for each tastant (same colors as in panel D). D. Trial averaged running correlation between population activity evoked by ExpT in the first 125 ms and the time course of the average response to UT. Black solid line: average across tastants; the shading around the black solid line represents the SEM of the difference; color coded dashed lines: data for each tastant (S = Sucrose - blue; Na = NaCl - cyan; CA = Citric Acid - yellow; Q = Quinine - red). The dashed box highlights the wide correlation with the first and second bin after UT. E. Example of a single neuron whose initial response to the ExpT (gray portion of the PSTH below) is similar to the response produced in the second 125 ms by UT (gray portion in the PSTH above); taste stimulation is at t = 0. The population used for this figure is the same as for Figure 5B, C and D (i.e. putative pyramidal neurons, n = 40).

