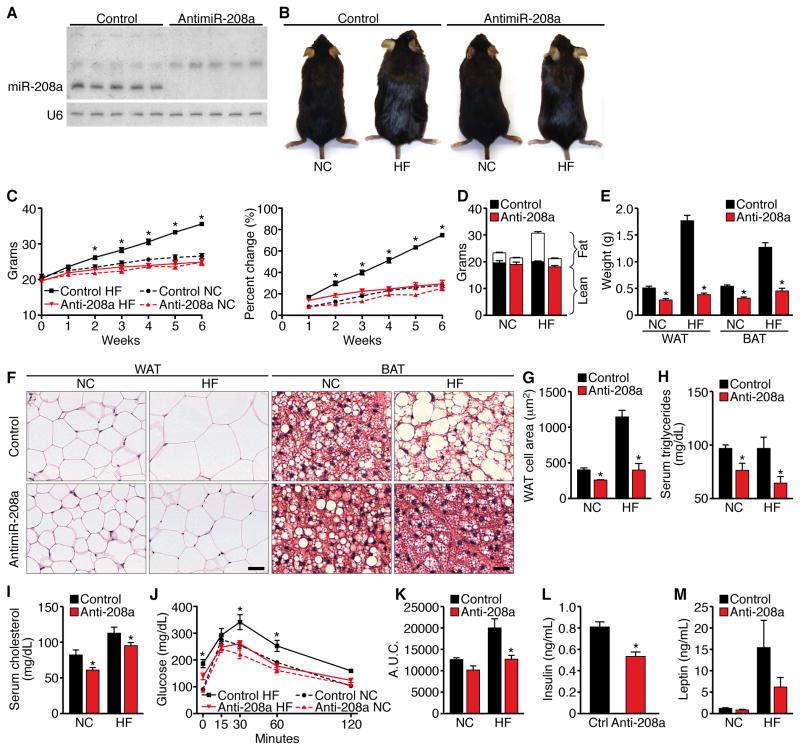
Figure 1. Mice Administered AntimiR-208a are Resistant to Obesity and Glucose Intolerance.
antimiR-208a or control antimiR treated mice on NC or HF diet for 6 weeks n=8–10 unless otherwise stated.
(A) Northern blot analysis of mice treated for 6 weeks with antimiR-208a or control antimiR (control). U6 RNA was detected as a loading control. Hearts from 5 mice from each treatment were analyzed. Note the absence of miR-208a in antimiR-208a-treated hearts.
(B) Pictures of mice treated for 6 weeks.
(C) Growth curves and percentage increase in body weight.
(D) Body composition measured by NMR to determine fat mass and lean tissue mass.
(E) Weight of visceral WAT and subscapular BAT.
(F) H&E stain of visceral WAT and subscapular BAT. Scale bar = 40μm
(G) Cell size of visceral WAT. n=5 Images from 3 sections 200mm apart were analyzed from 7–8 mice in each group representing >500 cells.
(H) Serum triglyceride levels. n=5
(I) Serum cholesterol levels. n=5
(J) Glucose tolerance test (GTT).
(K) Area under the curve for GTT.
(L,M) Fasting insulin and leptin levels. Data are represented as mean ± SEM. n=5 for NC and n=13 for HF diet for all experiments unless stated otherwise. *p<0.05

