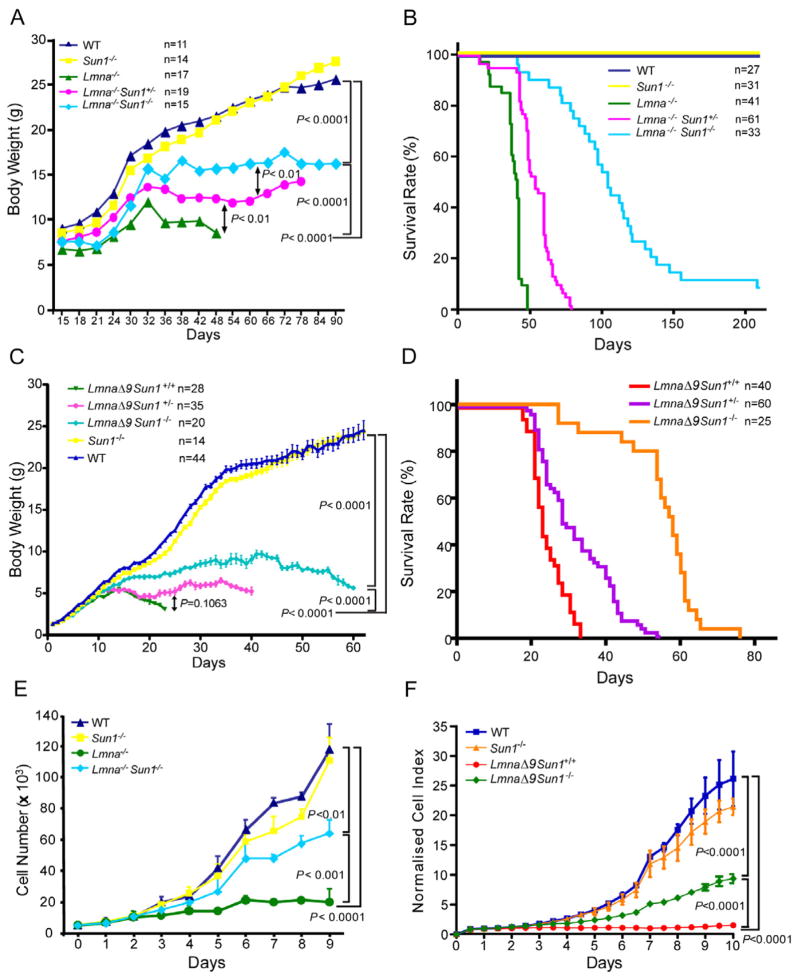
Figure 1. Defects in body weight and longevity in Lmna−/− and LmnaL530P/L530P (LmnaΔ9 mice) mice are ameliorated in homozygous Sun1 knockout Lmna−/−Sun1−/− and LmnaΔ9Sun1 −/− animals.
(A) Body weights are averages from mice with the indicated genotypes. The number (n) of animals used is indicated.
(B) Kaplan-Meier graph showing increased life span of Lmna−/−Sun1−/− compared to Lmna−/− mice. Median survival of wild type or Sun1−/− is >210 days in a 7 month follow up; Lmna−/− mice have median survival of 41 days; Lmna−/−Sun1+/− mice have a median of 54 days; Lmna−/−Sun1−/− mice have a median of 104 days (P <0.01 comparing Lmna−/− and Lmna−/−Sun1−/−).
(C) Body weights of LmnaΔ9 mice that are wild type, heterozygous, or homozygous for Sun1 deficiency. Wild type and Sun1−/− cohorts are graphed for comparison. Values are averages+/−SEM from animals in each cohort. Number (n) of animals is indicated. (P <0.0001 comparing LmnaΔ9Sun1 +/+ and LmnaΔ9Sun1 −/−).
(D) Kaplan-Meier graph showing increased life span of LmnaΔ9Sun1 −/− compared to LmnaΔ9Sun1 +/+ mice. LmnaΔ9Sun1 +/− mice are also graphed. (P <0.0001 comparing LmnaΔ9Sun1 +/+ and LmnaΔ9Sun1 −/−).
(E) Cell proliferation of the indicated MEFs. Curves are averages+/−SD, representative of >3 independent isolates from embryos of the indicated genotypes.
(F) Proliferation curves of MAFs (mouse adult fibroblasts) from WT, Sun1−/−, LmnaΔ9Sun1 +/+ and LmnaΔ9Sun1 −/− mice. MAFs were seeded at a density of 1000 cells per well. Growth was measured, and normalized cell indexes (averages+/−SD) are presented.

