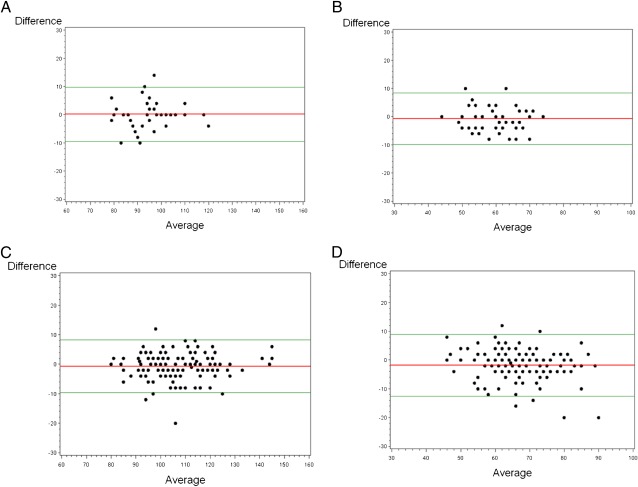
FIGURE 1.
Agreement between aneroid and mercury devices. The red line indicates the mean difference between readings, and the green line is the 95% confidence intervals of agreement. Bland-Altman Plots: A, systolic BP, age 0–9. B, diastolic BP, age 0–9. C, systolic BP, age 10–18. D, diastolic BP, age 10–18.

