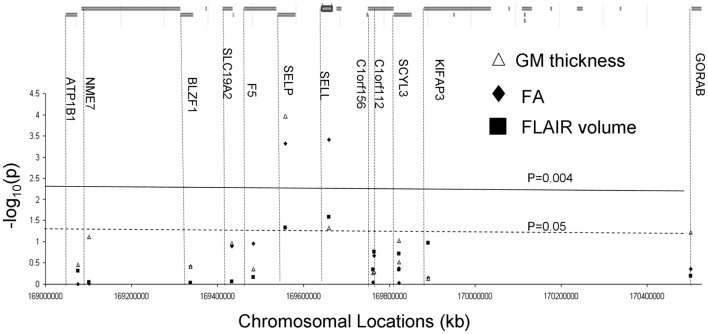
Figure 3.
Genes located under the QTL flanked rs137915045 and rs111909575. Results (−log 10 of the p-value) of the correlation analysis for expression levels for the genes located under the linkage peak are plotted along the x-axis (bottom). The solid line corresponds to the significant evidence value of p = 4 × 10⁻³. The green line corresponds to the suggestive evidence value of p = 0.05.

