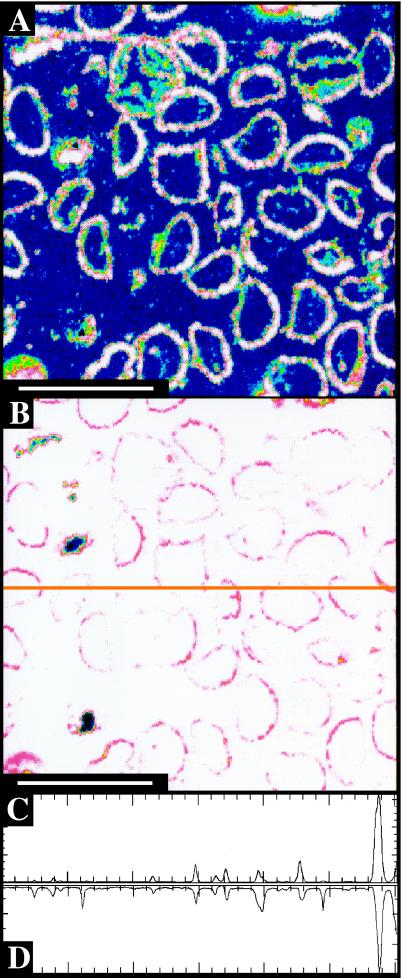
Figure 2.
Spores within a sporangium of unknown affinity from the Rhynie Chert. (A) Carbon map. (B) Silicon map; orange line is approximate location of transect in C and D. (C) Carbon abundance along transect, scale ranging from 0 to 1,200 counts. (D) Silicon abundance along transect, scale ranging from 120,000 to 240,000 counts. (Scale bars, 100 μm.)

