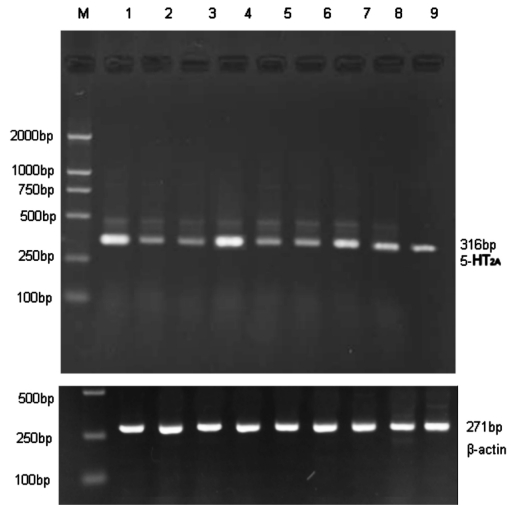
Figure 1. Electrophoresis result of 5-HT2A mRNA expression in retina, choroids and sclera of two groups.
M: DNA maker (100bp-1000bp); 1-3 Retina, 1: LIM eye; 2: LIM control eye; 3: Normal control eye. 4-6 Choroids, 4: LIM eye; 5: LIM control eye; 6: Normal control eye. 7-9 Sclera, 7: LIM eye; 8: LIM control eye; 9: Normal control eye

