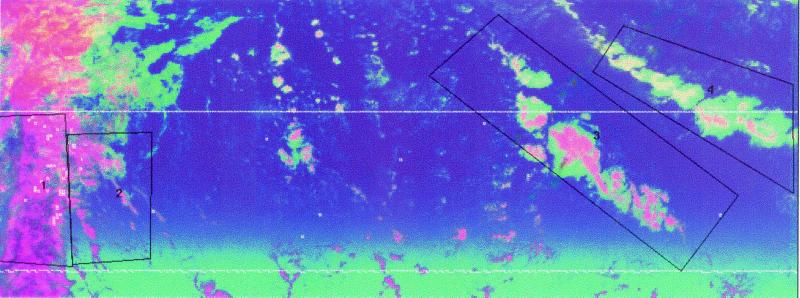
Figure 5.
Satellite visualization showing the impact of Saharan dust on cloud microstructure and precipitation. The image was taken by the TRMM visible and IR detector on March 1, 2000 16:06 GMT, west of the Sahara (36W-46W). The visible modulates the red, 3.7-μm reflectance for green, and T for the blue. The white patches in frames 1 and 2 represent precipitation echoes observed by the TRMM precipitation radar. The two parallel lines delimit the 220-km precipitation radar swath, oriented from the dust-free zone in the northwest to the dusty area in the southeast (left to right, respectively), as shown in Fig. 4. The image shows clouds with large droplets (red colors) and precipitation in the dust-free area (1 and 2), gradually reducing the size of droplets and decreasing the precipitation in transition to the dusty area (frames 3 and 4).

