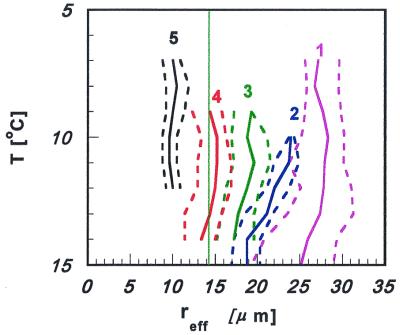
Figure 6.
Analysis of the T-re relations for marine stratocumulus forming with different amounts of desert dust. Lines 1–4 correspond to frames 1–4 in Fig. 5, which go from dust free (frames 1 and 2) to dust-laden air (frame 4). Line 5 corresponds to clouds forming in heavy dust storm, as shown in Fig. 4 Right. Note the decreasing re with increasing amounts of dust from lines 1 to 5.

