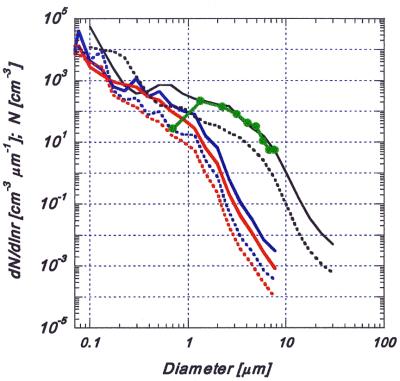
Figure 8.
The particle size distribution during Saharan dust storms. The green points are in situ measurements of dust concentrations made at Tel Aviv during the storm of March 17, 1998. The black lines represent concentrations retrieved from sky radiometers in Sde-Boker (solid line) and Cape Verde (dashed line) during Saharan dust storms. The CCN concentrations are calculated by assuming that all of the vertically integrated particles are concentrated in a 1-km vertical column. The conversion of dust into CCN concentrations is represented by the blue lines (Sde-Boker, solid; Cape Verde, dashed). The red lines (Sde-Boker, solid; Cape Verde, dashed) represent the cumulative concentrations of the CCN, beginning with the largest bin size.

