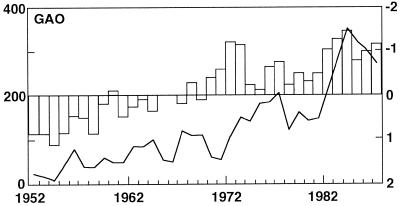
Figure 9.
Frequency of dust occurrence from 1957 to 1987 at Gao, 16o16′N, 00o02′W, (solid line, left vertical axis) compared with rainfall anomalies (bar graph, right vertical axis) for the Sahelian region as a whole. Rainfall is expressed as a regionally averaged, standardized departure (departure from the long-term mean divided by the standard departure), but the axis of the rainfall graph is inverted to facilitate comparison with dust occurrence. Dust is represented by the number of days with dust haze. [Reproduced with permission from ref. 32 (Copyright 1997, American Meterological Society)].

