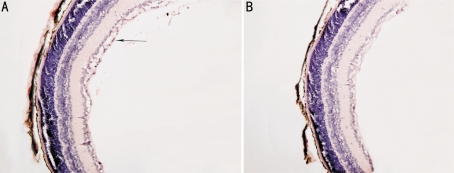
Figure 2. Quantification of RNV by HE staining method (×200).
A: Section of P17 retina from control group. Arrow denotes retinal neovascular cell nuclei anterior to the ILM; B: Section of P17 retina from treated group. A marked reduction in preretinal neovascularization was apparent compared with that in control group

