
Figure 3.
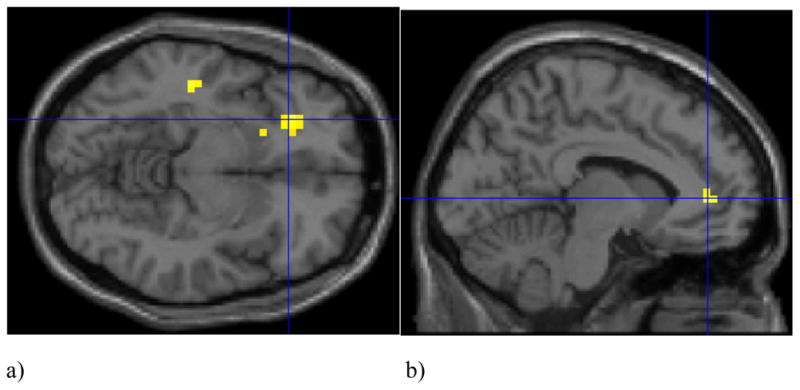
Statistical parametric maps indicating significant negative correlations between threat bias score and activation in the a) ventrolateral prefrontal cortex (vlPFC; Talairach x = −28, y = 30, z = −12, t= 3.2) and b) anterior cingulate cortex (ACC; Talairach x = −8, y = 43, z = 2, t=2.9) to threatening versus happy and neutral face pair trials in PTSD+ participants. Activations are shown overlaid onto an averaged structural MRI. Figure presented at p < 0.005 (uncorrected) threshold.