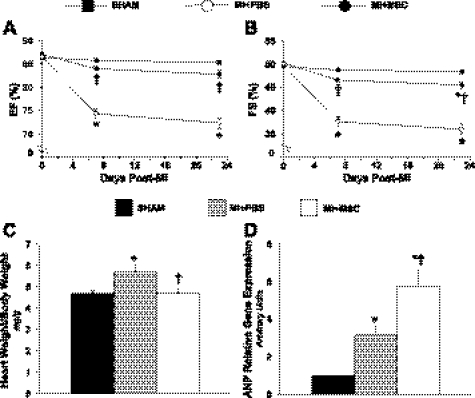
Fig. 2.
Cardiac functional and structural indices. A: cardiac ejection fraction (EF) at BL, 7 and 23 days following a MI. B: fractional shortening (FS) at BL, 7 and 23 days following a MI; n = 15–19 mice/group. C: heart weight/body weight ratio 28 days following a MI; n = 12–18 mice/group. D: cardiac atrial natriuretic peptide (ANP) gene expression 28 days following a MI relative to the SHAM mice; n = 6–7 mice/group. Data are means ± SE. *P < 0.05 vs. SHAM; †P < 0.05 vs. MI + PBS.

