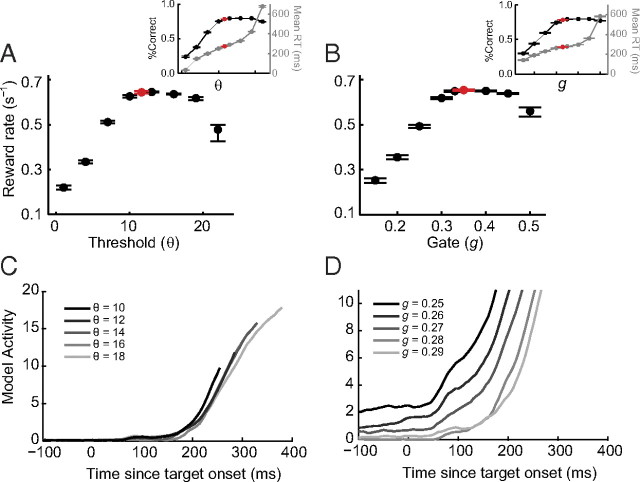
Figure 12.
Threshold and gating inhibition can explain speed–accuracy trade-offs. A, B, Mean expected reward rate as a function of the threshold (A) and gate (B) values when other parameters are fixed at the values that best fit the pooled search performance. Insets show simulated mean percent correct (black) and RT (gray) corresponding to the parameter values used to simulate the reward rates in A and B. Each point is calculated by a simulated session with 700 trials per set size, which approximates the average number of trials recorded per session. Error bars are 95% confidence intervals around the mean, which may be asymmetric due to skewed distributions (bootstrap; 1000 simulations). The red points show expected reward rate using parameters that best fit the animal's performance. C, D, Gated accumulator dynamics for threshold (C) and gate (D) spanning a range of reward rates. Each trajectory reflects the average of 1000 simulated trajectories for a given set of parameters. As threshold increases, the accumulation begins at the same time, but reaches progressively higher levels. As gate increases, baseline activity decreases and accumulation begins rising later.

