
Figure 8.
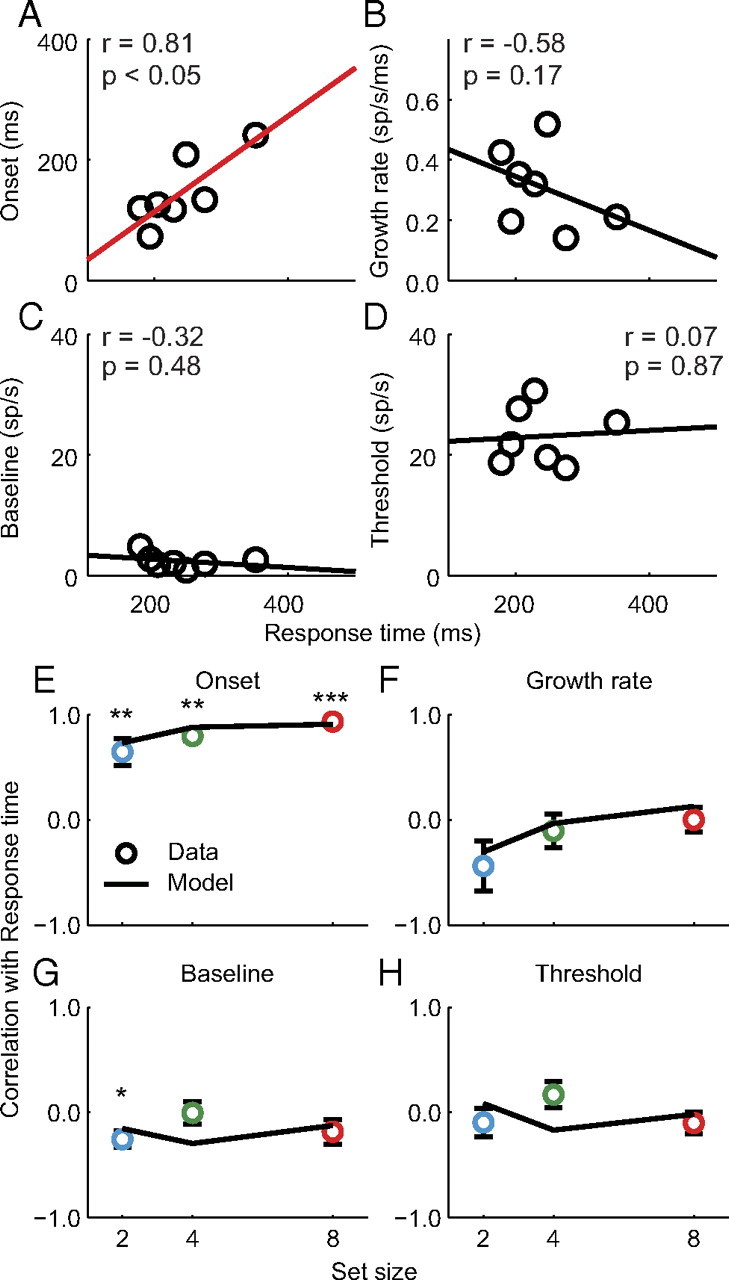
Quantification of movement neuron and gated competitive accumulator model dynamics across response time bins within each set size. A–D, Onset of the presaccadic burst (A), growth rate of firing rate rise to threshold (B), baseline firing rate (C), and presaccadic firing rate threshold (D) as a function of RT bins for a representative neuron (see Materials and Methods). For simplicity, only set size 4 is shown. Lines illustrate the least-squares regression line fit to the data. Red lines indicate significant Pearson correlation coefficients (p < 0.05). E–H, Median correlation between each measure of neural dynamics and response time for observed movement neurons (circles) and simulated model dynamics (lines). Error bars indicate SE of the median for observed data (bootstrap; 1000 samples). Asterisks indicate median correlations that significantly differed from zero (Wilcoxon rank sum test, *p < 0.05; **p < 0.01; ***p < 0.001).