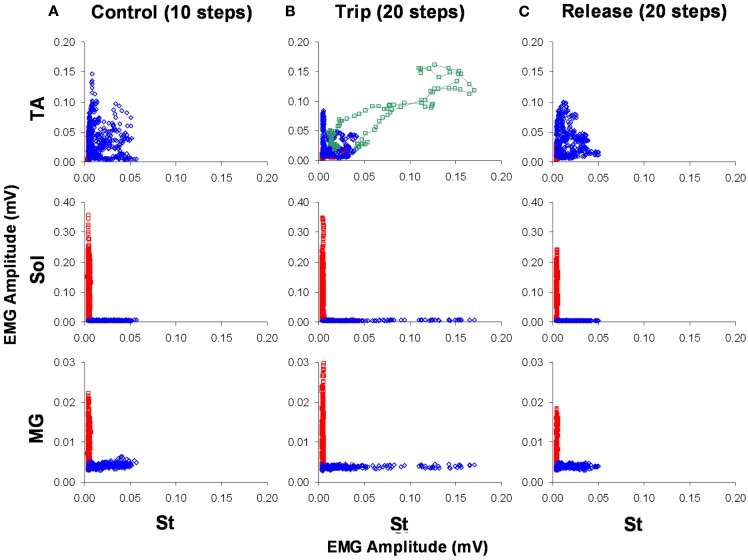
Figure 10.
The level of activation of the TA, Sol, and MG vs. the St for a sequence of 10 control (A), 20 trip (B), and 20 release steps (C) is shown. Blue and red represent the swing and stance phases of the step cycle, respectively. The green symbols in (B) represent the co-activation between the TA and St immediately after the trip. The data points are a five-point running average of the mean normalized EMG. Note the higher level of activation of the St during the trip compared to the control and release steps.

