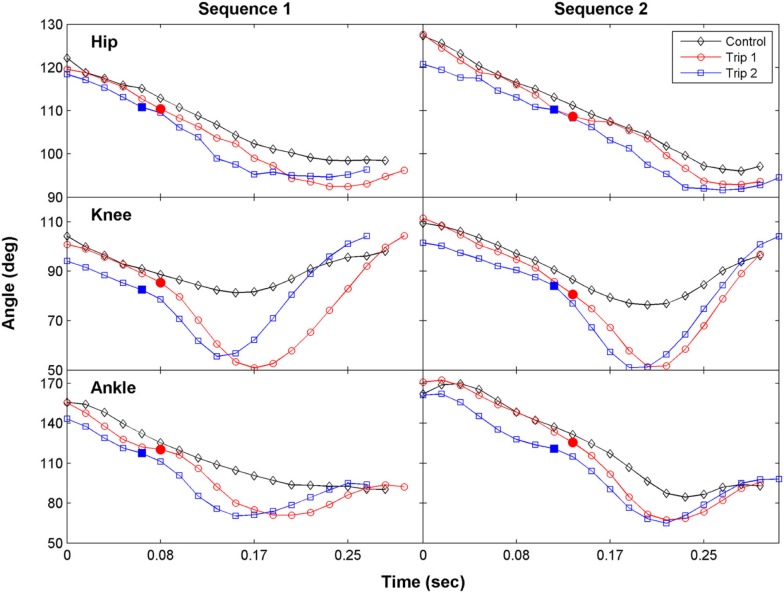
Figure 2.
The time course of the changes in the hip, knee, and ankle joint angles during the swing phase for a control, Trip 1, and Trip 2 step are shown for two tripping sequences in a representative cat. The solid symbols indicate the time when the foot touches the trip rod. The kinematics of Trip 2 reflect an adaptive response relative to Trip 1 at all three joints in both sequences. The stick figures in Figure 1B were generated from the data shown for the first sequence.

