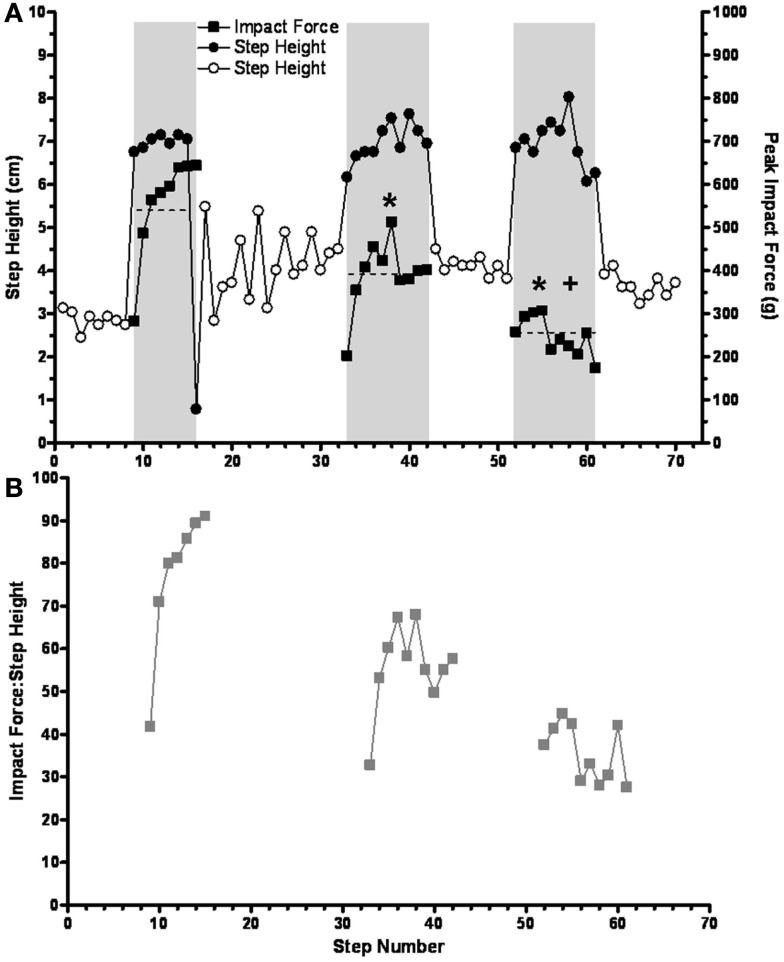
Figure 7.
(A) The mean impact force on the trip rod (horizontal dashed lines) is shown to progressively decrease during three successive short trip-release sequences. Solid symbols, trip steps; open symbols, control steps; shaded areas, trip series. (B) The ratios of peak impact force and step height are shown for the same trip sequences in (A). Note that the results in both (A) and (B) reflect a learning-related phenomenon that occurs over a time frame of seconds. * and +Significantly different from the first and second trip sequence, respectively.

