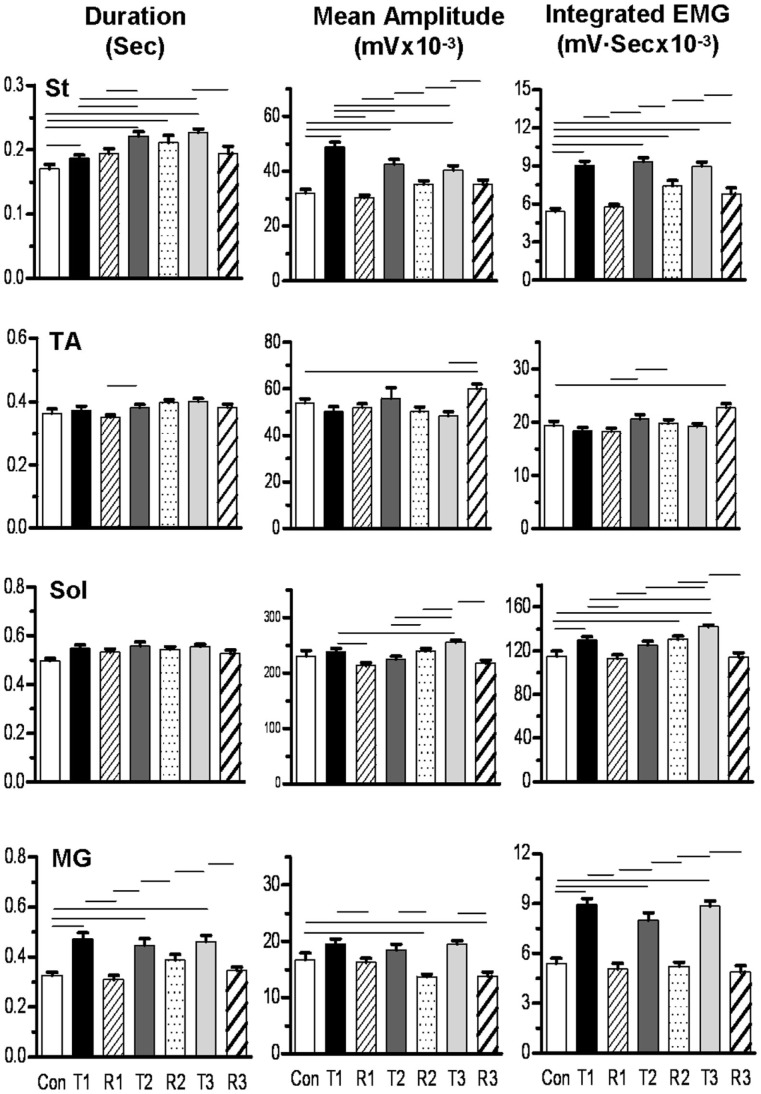
Figure 8.
Bar graphs showing the mean (SEM) burst duration, amplitude, and integrated EMG for the semitendinosus (St), tibialis anterior (TA), soleus (Sol), and medial gastrocnemius (MG) muscles for three trip-release sequences for a representative cat. Con, control sequence, 10 steps; T1, first trip sequence, 20 steps; R1, first release sequence, 20 steps; T2, second trip sequence, 20 steps; R2, second release sequence, 20 steps; T3, third trip sequence, 20 steps; R3, third release sequence, 20 steps. The horizontal lines above the bars denote significant differences between conditions at P < 0.05. Note that the St showed the highest activation levels compare to control during the trip steps and that the MG showed a qualitatively similar pattern as the St.

