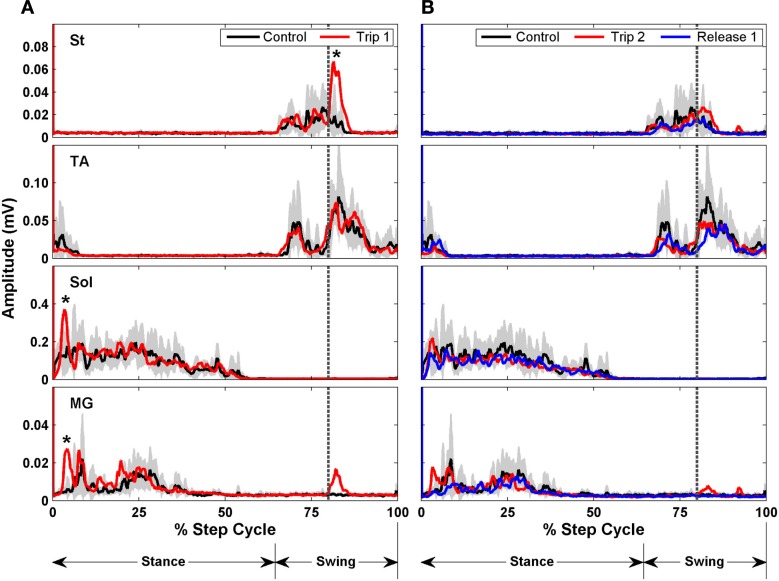
Figure 9.
Rectified EMG bursts for the St, TA, Sol, and MG of control (black traces, 10 steps preceding Trip 1), Trip 1 [red traces in (A) 20 steps], Trip 2 [red traces in (B) 20 steps], and release 1 [blue traces in (B), 20 steps] sequences. The gray shading is the SD for the control sequence. Muscle abbreviations, same as in Figure 8. *Significantly higher than in the control and release sequences.

