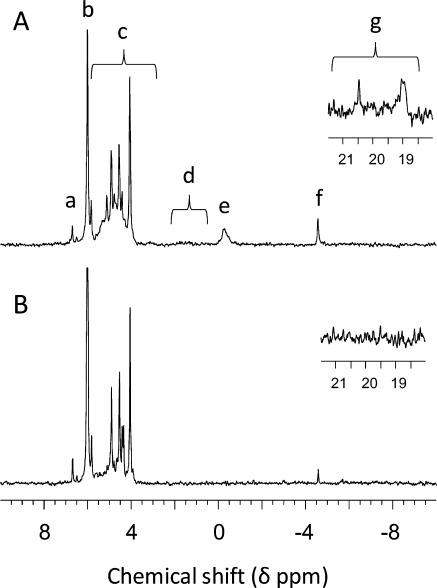
Figure 3.
Solution 31P NMR spectra of NaOH–EDTA extracts of a soil (East 50) from the Falkland Islands before (A) and after (B) pretreatment with hypobromite oxidation to destroy all organic phosphorus other than the higher-order inositol phosphates. The zoomed insets show the phosphonate signals between δ = 19 and 21 ppm. Spectra are plotted with 5 Hz line broadening. In (B) the spectrum is truncated vertically to show the scyllo-inositol hexakisphosphate signal at the same height in both spectra. Signal assignments are as follows: a, neo- and d-chiro-inositol hexakisphosphate; b, inorganic orthophosphate; c, phosphomonoesters other than the signals from neo- and d-chiro-inositol hexakisphosphate between δ = 6.4 and 6.9 ppm; d, alkali-stable phospholipids; e, DNA; f, pyrophosphate; g, phosphonates.

