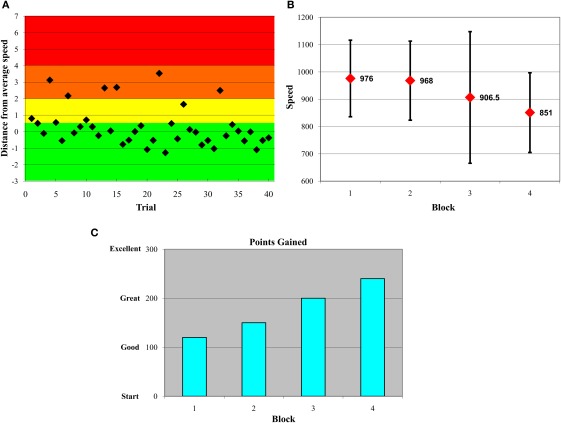
Figure 1.
Variability-reduction feedback plots. All participants in the feedback condition were shown plots such as these in serial order. Plots (A–C) represent data from an example participant. (A) Within-block trial-by-trial performance feedback plot. Participants were awarded 10 points if a trial response was in the green zone, −10 if in the yellow zone, −20 if in the orange zone, and −50 if in the red zone. The y-axis represents numbers of standard deviations from a participant's own median from the previous block. (B) Feedback plot of response time medians and SDs across blocks. (C) Feedback plot of points gained across blocks.

