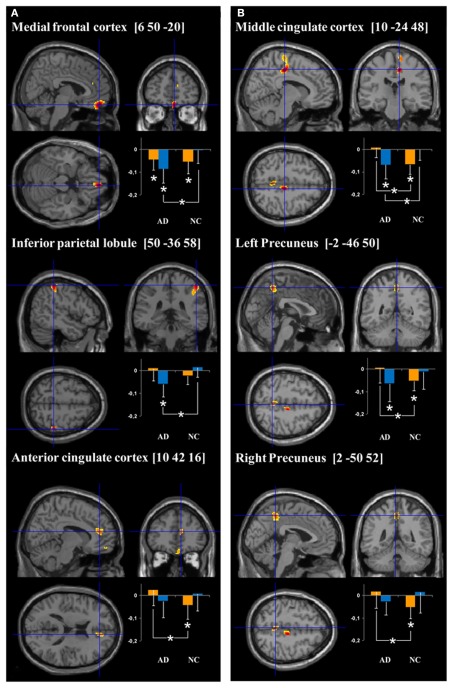
Figure 2.
Cerebral regions showing hyperactivation in AD patients compared to normal controls (NC) for (encoding – reading) and (stem-cued recall – stem-completion) contrasts (respectively A and B). Plots represent the signal change during target (orange bars) and control (blue bars) conditions relative to rest in AD and NC groups. More precisely, the orange bars correspond to the mean intensity of the subtraction target – rest conditions (i.e., “intentional encoding – rest” in A and “stem-cued recall – rest” in B) and the blue bars to the mean intensity of the subtraction control – rest conditions (i.e., “reading – rest” in A and “stem-completion – rest” in the B). The units correspond to the mean intensity of the scaled CBF values in the ROIs. *p < 0.05.

