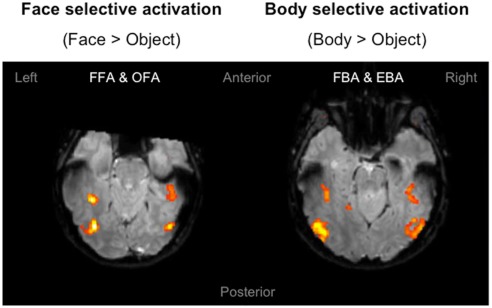
Figure 3.
Localizer activation maps of face and body selective clusters. Examples of activation maps of face and body selective clusters as defined by the independent localizer, displayed on axial functional image slices. The clusters were defined by contrasting the BOLD signal associated with the presentation of faces and bodies compared to objects. Contrasts were calculated using t-tests with family-wise error (FWE) corrections for multiple comparisons (p < 0.05).

