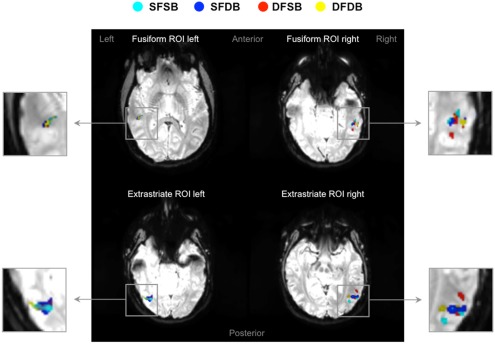
Figure 5.
fMRI adaptation effects in fusiform and extrastriate ROIs. Four examples of activation maps, one for each ROI, showing condition specific adaptation effects displayed on functional image slices.  : Same Face – Same Body (SFSB);
  : Same Face – Different Body (SFDB);
  : Different Face – Same Body (DFSB);
  : Different Face – Different Body (DFDB). Contrasts were calculated using t-tests with family-wise error (FWE) corrections for multiple comparisons (p < 0.05).

