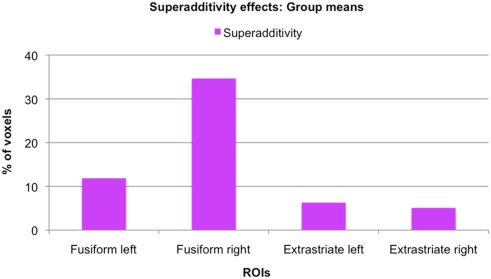
Figure 8.
Size of superadditivity effects: Group means. For each ROI, the graph displays the mean percentage of voxels of the original SFSB condition specific adaptation effects that also showed superadditivity, that is where the SFSB adaptation effect was bigger than the sum of the adaptation effects of all other conditions.

