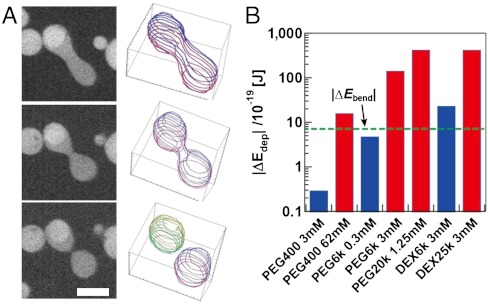
Fig. 4.
Estimation of the free energy. (A) Confocal images and 3D representation of the typical shape transformation at the late phase of budding. Constriction of the elongated shape develops towards budding. (Scale bar: 5 μm.) (B) ΔEdep calculated for the hypothetical transformation from a spherocylinder into two spheres (5-μm diameter was assumed) in various experimental conditions. Red and blue bars, respectively, represent the conditions in which the budding transformation occurred (Pbud > 0.1) and did not occur (Pbud < 0.1). The green horizontal line shows the estimated increase of bending energy of the membrane.

