Fig. 2.
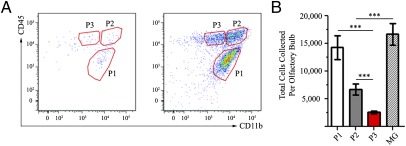
EYFP+ bDC within the VSV-infected OB exhibit three phenotypically distinct populations at 96 hpi. (A) Three distinct EYFP+, CD45+, and CD11b+ populations. (B) Analysis of the differences in each CD45+ and CD11b+ population shows that the P1 population represents the majority of EYFP+ cells; the P2 and P3 populations were less abundant. The EYFP+ cell numbers found within the P1 population are nearly double those in the P2 and P3 populations combined. Data representative of three separate experiments with n = 3; error bars represent SEM. ***P < 0.001

