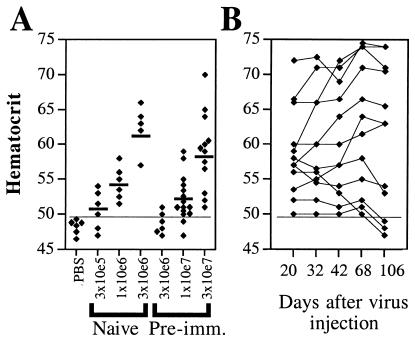
Figure 6.
Gene transduction by C4AFO-mEPO injection in preimmunized mice. (A) Hcts 14 days after C4AFO-mEPO injection. The short thick lines indicate the average Hct of mice challenged i.m. with C4AFO-mEPO. The doses injected are shown. (B) Longevity of Hct increase in individual preimmunized mice challenged with 3 × 10⁷ i.u. of C4AFO-mEPO. The days p.i. are shown. The thin horizontal line in both panels indicates the level above which the Hct is significantly different from the average Hct of age-matched PBS-injected mice.

