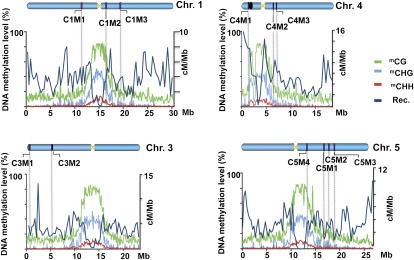
Fig. 4.
Distribution of In/Del markers along different Arabidopsis chromosomes. Eight different pairs of InDels were selected and tested in an F2 population resulting from a cross between ecotypes Columbia and Landsberg. Markers are shown as vertical lines on the chromosomes (Chr1–5) and were positioned in the diagram by physical coordinates. The percentage of methylation (y axes) along the chromosomes (taken from ref. 56) is shown as green, light blue, and red lines for mCG, mCHG, and mCHH, respectively. Markers were chosen as being in the heterochromatic region when they had an mGC level (green line) >30% in chromosome 1 (C1M1 and C1M2, around the centromere; C1M2 and C1M3 pericentric region), in chromosome 4 (C4M1 and C4M2 surrounding the knob and centromere; C4M2 and C4M3 pericentric region), and in chromosome 5 (C5M4 at a pericentric region and C5M1 at euchromatic region). Markers representing euchromatic regions are shown in chromosome 3 (C3M1 and C3M2), and two pairs of markers with mGC levels <30% are shown in chromosome 5 (C5M1, C5M2, and C5M3). Chromosome 3 contains the fluorescent markers used in this study (marked in red and green). The dark blue line represents the genome-wide crossover distribution, calculated as the average recombination rate (Rec.) in male and female meiocytes, from data of Giraut et al (52). The yellow triangles represent the centromeres of each chromosome. The black oval on chromosome 4 represents the knob. Adapted by permission from Macmillan Publishers Ltd: [Nature] (56), copyright (2008).

