Fig. 2.
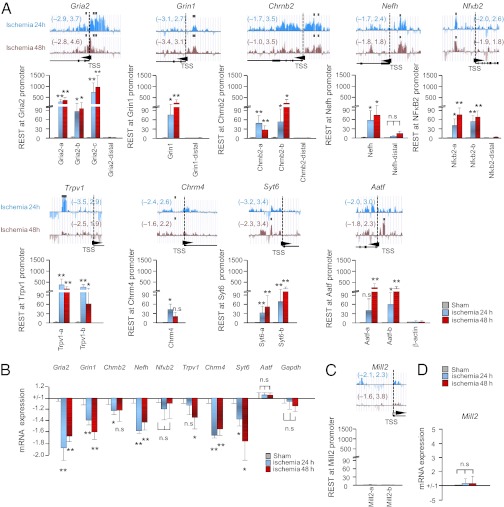
REST regulates a subset of “transcriptionally responsive” target genes in CA1. (A) (Upper) REST profiles across a subset of validated target genes were assessed by ChIP-on-chip analysis in postischemic CA1. Altogether, 13 target genes exhibited REST enrichment at promoter sites at 24 h and 48 h after ischemia (Table 1). Numbers in parentheses denote log-fold changes in REST enrichment in ischemic vs. control CA1. Black squares denote “hot spots” of REST enrichment. Arrowheads denote transcriptional start sites (TSSs) and transcriptional direction. (Lower) Technical validation was assessed by single-locus ChIP, followed by qPCR, at sites upstream and downstream of TSSs of 9 genes with REST enrichment as assessed by ChIP-on-chip analysis (gria2, grin1, chrnb2, nefh, nfκb2, trpv1, chrm4, syt6, and aatf). (B) Genes that exhibited REST enrichment by ChIP-on-chip analysis exhibited reduced mRNA and protein expression (biological validation). Nfκb2 and Aatf are not significantly changed. (C) Single-locus ChIP-qPCR assay shows that Mill2, which contains an RE1 site, does not exhibit enhanced REST association. (D) Mill2 mRNA expression is not altered (negative control). Statistical significance was assessed by pairwise comparisons between experimental samples and corresponding control samples by means of the two-tailed Student t test. *P < 0.05; **P < 0.01; n.s., nonsignificant.

