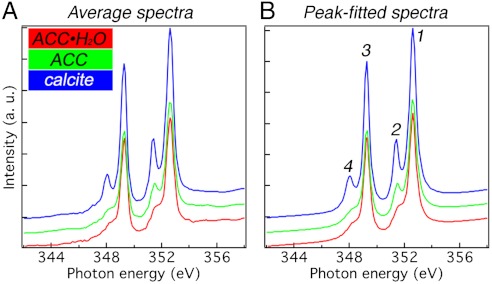
Fig. 1.
The three reference spectra used for component analysis. (A) XANES spectra across the calcium L-edge extracted from sea urchin spicules. To minimize experimental noise, 6–10 independently acquired single-pixel spectra, with pixel sizes of 20 nm, were averaged to give each reference spectrum. (B) Spectra resulting from peak-fitting the spectra in A, which completely eliminates experimental noise from these spectra, thus they can be used as reference components for all analyses in this work. The red spectrum is hydrated amorphous calcium carbonate (ACC·H2O, see Fig. S1), the green spectrum is anhydrous ACC, and the blue spectrum is crystalline calcite, as identified by Politi et al. (16). A comparison of the three spectra highlights that the main peaks labeled 1 and 3 do not vary across the three mineral phases, whereas peaks 2 and 4 do vary. Specifically, in red ACC·H2O both peaks are low, in green ACC peak 2 is high and peak 4 is low, whereas in calcite both are high. More details on how these spectra were obtained are provided in Fig. S2 and Table S1.

