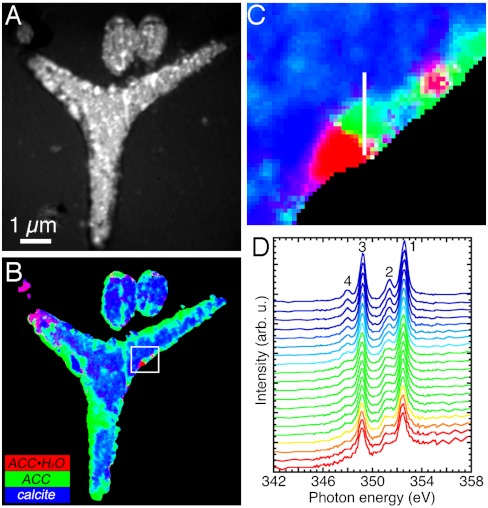
Fig. 2.
Component mapping in 48-h spicules, at the prism developmental stage, analyzed within 24 h of extraction from the embryo. (A) XANES-PEEM image of three spicules embedded in epoxy, polished to expose a cross-section, and coated. The image is an average of all 121 images acquired across the Ca L-edge. The larger triradiate portion of a spicule at the center is polished in plane, whereas two other cylindrical spicules at the top have their long axes perpendicular to the plane of the image. (B) RGB map displaying the results of component mapping, in which each component is color-coded as in Fig. 1. The box indicates the region magnified in C. (C) Zoomed-in portion of the RGB map in B, where each 15-nm pixel shows a different color. Pure phases are R, G, or B, whereas mixed phases are cyan, magenta, or yellow, according to the rules of additive color mixing: G + B = C, R + B = M, R + G = Y (59). The white vertical line shows the positions of the 20 pixels from which the spectra in D were extracted. (D) Sequence of 20 XANES spectra extracted from 15-nm adjacent pixels along the white line in C. The color-coding is the same as used in B, C, and Fig. 1. Notice that the white line in C runs from the outer rim of the spicule (red), passing through orange, yellow, green, cyan, and finally blue, toward the crystalline center of the spicule. Correspondingly, moving from bottom to top across the spectra in D, one can see peak-2 growth leading, and peak-4 emergence and growth lagging.

