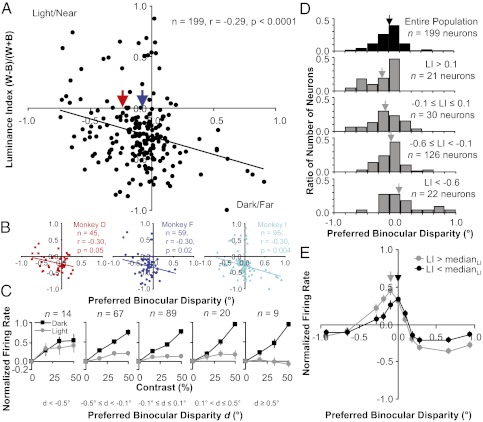
Fig. 3.
Negative correlation between luminance index and preferred binocular disparity. (A) Aggregate scatter plot of measurements made from neurons recorded from all three monkeys. (B) Scatter plot of measurements made from neurons recorded from each monkey individually. (C) Population average of contrast response curves for light and dark disks. Each plot uses a different group of neurons on the basis of their preferred disparity d. The response to a blank gray screen (0%) was subtracted from the contrast response curve for each neuron and then the curve was normalized by the peak firing rate before averaging. Error bars are population SE. (D) Histograms of preferred binocular disparity. Each histogram uses a different group of neurons on the basis of their luminance index LI, ranging from preferring white to preferring black (top to bottom). Arrows are mean preferred binocular disparity. (E) Population average of disparity tuning curves. Each plot uses a different group of neurons on the basis of their luminance index LI. The mean response to all disparities was subtracted from the disparity tuning curve for each neuron and then the curve was normalized by the peak firing rate before averaging. Error bars are population SE.

