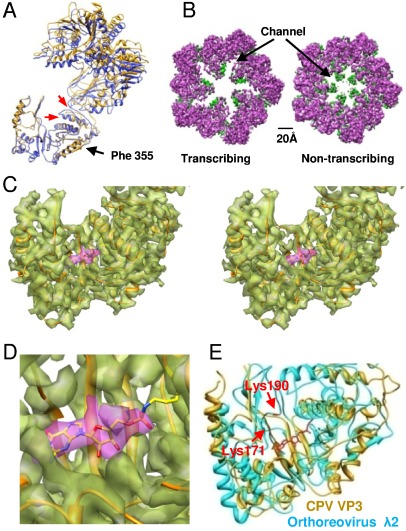
Fig. 4.
Turret protein VP3. (A) The VP3 of transcribing CPV (yellow) superimposed on the VP3 of nontranscribing CPV (blue). Two red arrows point to conformational changes of a loop and an α-helix. (B) A comparison of the turret of transcribing and nontranscribing CPV. The color scheme is the same as that in Fig. 2B. (C) A wall-eye stereo view of the density map (transparent) of the VP3 GTase domain with its atomic model superimposed. The density map of the GMP moiety is in purple. (D) Zoom-in view of the GMP in C. (E) The CPV VP3 GTase domain is superimposed on that of orthoreovirus λ2. The locations of Lys 190 and Lys 171 in λ2 are marked. The GMP moiety in VP3 is in red.

