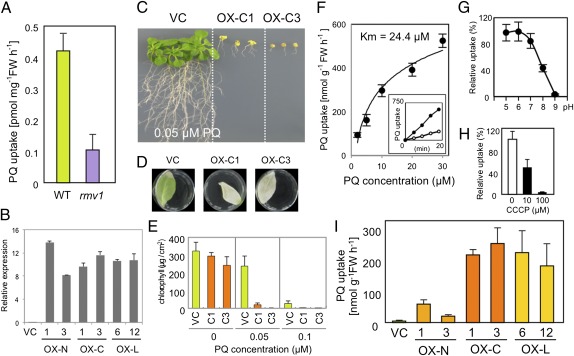
Fig. 3.
PQ transport by RMV1. (A) PQ uptake of the wild-type (Ler-1) and rmv1 mutant. Error bars represent SD (n = 3). (B) RMV1 transcript levels of vector control (VC) and RMV1 transgenic lines (OX-N, -C, or -L). The RMV1 transcripts were detected by real-time quantitative RT-PCR using total RNA extracted from 10-d-old seedlings. (C–E) PQ sensitivity of transgenic Arabidopsis (Col-0) plants expressing Col-type RMV1. (C) Root growth on MS plates containing 0.05 μM PQ. (D) Fully expanded leaves of transgenic plants were floated on buffer containing 3 mM MES, 0.1% Tween-20, and 0.1 mM PQ for 2 d. (E) Chlorophyll contents of leaves floated on the indicated concentrations of PQ. Error bars represent SD (n = 5). (F) Concentration-dependent kinetics of PQ influx into roots of OX-C1 plants. Seedlings were incubated with increasing concentrations of PQ for 15 min before determination of intracellular radioactivity. Inset shows a time course of PQ uptake with 2 μM (open circles) or 30 μM (closed circles) PQ. The Km value was determined from the Hanes–Woolf plot. Uptake data were fitted to Michaelis–Menten and Hanes–Woolf equations. (G) pH dependence of PQ transport in OX-C1 plants. Seedlings were incubated in MS medium at indicated pH values containing 10 μM PQ for 15 min. (H) The effect of CCCP on PQ uptake activity of OX-C plants. Seedlings were incubated in MS medium containing 10 μM PQ with indicated concentrations of CCCP for 15 min. (I) PQ uptake of overexpressing lines. Error bars represent SD (n = 3).

